Graph - basic manipulation
This notebook illustrates the basic functionality of Graph.
It can be downloaded here.
from pyrigi import Graph
An easy way to construct a graph is to provide the list of its edges:
G = Graph([(0, 1), (1, 2), (2, 3), (0, 3)])
G
Graph.from_vertices_and_edges([0, 1, 2, 3], [(0, 1), (0, 3), (1, 2), (2, 3)])
Edges and vertices can be added:
G.add_vertices([0, 2, 5, 7, 'a', 'b'])
G.add_edges([(0, 7), (2, 5)])
G
Graph.from_vertices_and_edges([0, 1, 2, 3, 5, 7, 'a', 'b'], [(0, 1), (0, 3), (0, 7), (1, 2), (2, 3), (2, 5)])
or removed:
G.delete_vertex('a')
G
Graph.from_vertices_and_edges([0, 1, 2, 3, 5, 7, 'b'], [(0, 1), (0, 3), (0, 7), (1, 2), (2, 3), (2, 5)])
G.delete_vertices([2, 7])
G
Graph.from_vertices_and_edges([0, 1, 3, 5, 'b'], [(0, 1), (0, 3)])
G.delete_edges([(0, 1), (0, 3)])
G
Graph.from_vertices_and_edges([0, 1, 3, 5, 'b'], [])
There are also other ways how to construct a graph:
import pyrigi.graphDB as graphs
graphs.Complete(4)
Graph.from_vertices_and_edges([0, 1, 2, 3], [(0, 1), (0, 2), (0, 3), (1, 2), (1, 3), (2, 3)])
graphs.Complete(3, ['a', 1, (1.2)])
Graph.from_vertices_and_edges(['a', 1, 1.2], [('a', 1), ('a', 1.2), (1, 1.2)])
from sympy import Matrix
Graph.from_adjacency_matrix(Matrix([[0, 1, 1], [1, 0, 0], [1, 0, 0]]))
Graph.from_vertices_and_edges([0, 1, 2], [(0, 1), (0, 2)])
Graph.from_vertices(range(4))
Graph.from_vertices_and_edges([0, 1, 2, 3], [])
Graph.from_vertices_and_edges(range(6), [[i, (i+2) % 6] for i in range(6)])
Graph.from_vertices_and_edges([0, 1, 2, 3, 4, 5], [(0, 2), (0, 4), (1, 3), (1, 5), (2, 4), (3, 5)])
We can take the union of two graphs:
G = Graph([[0, 1], [1, 2], [2, 0]])
H = Graph([[0, 1], [1, 3], [3, 0]])
G + H
Graph.from_vertices_and_edges([0, 1, 2, 3], [(0, 1), (0, 2), (0, 3), (1, 2), (1, 3)])
G = Graph([[0, 1], [1, 2], [2, 0]])
H = Graph([[3, 4], [4, 5], [5, 3]])
G + H
Graph.from_vertices_and_edges([0, 1, 2, 3, 4, 5], [(0, 1), (0, 2), (1, 2), (3, 4), (3, 5), (4, 5)])
G = Graph.from_vertices_and_edges([0, 1, 2, 3], [[0, 1], [1, 2]])
H = Graph.from_vertices_and_edges([0, 1, 2, 4], [[0, 1]])
G + H
Graph.from_vertices_and_edges([0, 1, 2, 3, 4], [(0, 1), (1, 2)])
A vertex of a graph can be of any hashable type, but it is recommended to have all of them of the same type, not as above. If all vertices have the same type, the vertex/edge set can be sorted when a list is required; otherwise, the order might differ:
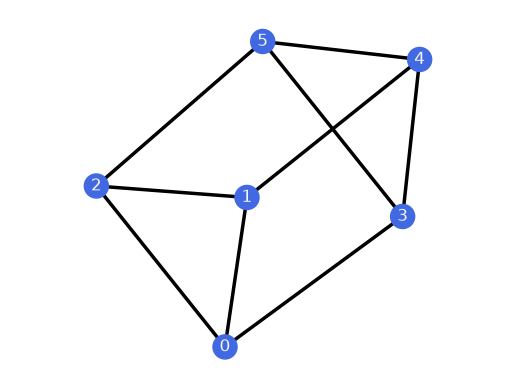
G = Graph([[0, 7], [2, 5], [1, 2], [0, 1], [0, 3], [2, 3]])
print(G.vertex_list())
print(G.edge_list())
print(Graph.from_vertices(['a', 1, (1, 2)]).vertex_list())
print(Graph.from_vertices([1, 'a', (1, 2)]).vertex_list())
[0, 1, 2, 3, 5, 7]
[[0, 1], [0, 3], [0, 7], [1, 2], [2, 3], [2, 5]]
['a', 1, (1, 2)]
[1, 'a', (1, 2)]
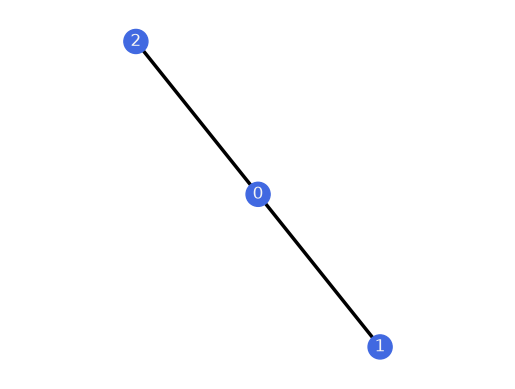
Alternatively, the adjacency matrix can also be used to construct a graph.
from sympy import Matrix
Graph.from_adjacency_matrix(Matrix([
    [0,1,1],
    [1,0,0],
    [1,0,0]])).plot()
Graph drawer
PyRigi comes with a graph drawer that lets the user input a graph by specifying the vertices (via a click). The edges can be added by dragging the mouse cursor from the head vertex and releasing the click on the tail vertex. Doing so creates an undirected edge.
from pyrigi import GraphDrawer
Drawer = GraphDrawer()
The resulting graph can then be output (and manipulated further) in the following way:
G = Drawer.graph()
Since the GraphDrawer also creates a realization,
we can use it to create a Framework
as well by calling framework().
As you can see in the GraphDrawer window, there are several stylistic choices which can
be used to change the appearance of a graph or a framework. To import them into pyrigi,
we can call
ps = Drawer.plot_style()
This creates a standard PyRigi PlotStyle ps which contains basic attributes
such as the vertex_size, vertex_shape, edge_width, edge_color, etc. They are
taken from the latest settings in the GraphDrawer.
The PlotStyle object can then be fed into the various plotting and animation methods
for graphs and frameworks in PyRigi.
Moreover, it is possible to alter the edge and vertex colors in the graph drawer individually.
vertex_colors_custom = Drawer.vertex_colors()
edge_colors_custom = Drawer.edge_colors()
These methods create dictionaries mapping the colors in hexadecimal to all vertices or edges that are affected. The outputs can be used in plotting and animation routines in the following way:
G.plot(vertex_colors_custom=vertex_colors_custom, edge_colors_custom=edge_colors_custom)

Graph database
Alternatively, many common graphs in rigidity theory are already implemented in the
graph database graphDB. Graphs from the database can be imported via the following
command:
import pyrigi.graphDB as graphs
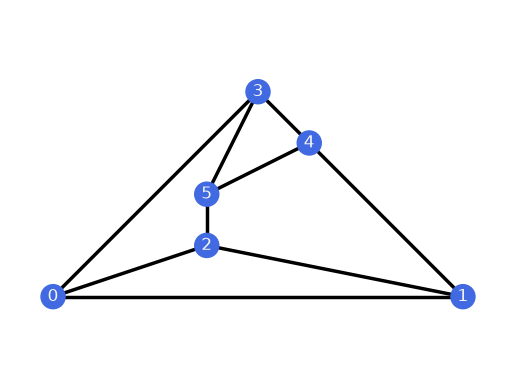
G3 = graphs.ThreePrism()
G3.plot()
G3.plot(layout="planar")